Data Center
download Our Economic Overview here!
In addition to the information provided on this page, our staff can compile customized market reports, traffic counts, custom defined radius demographics, aerial mapping, GIS mapping, and much more upon request.
45-Minute Labor Draw Area
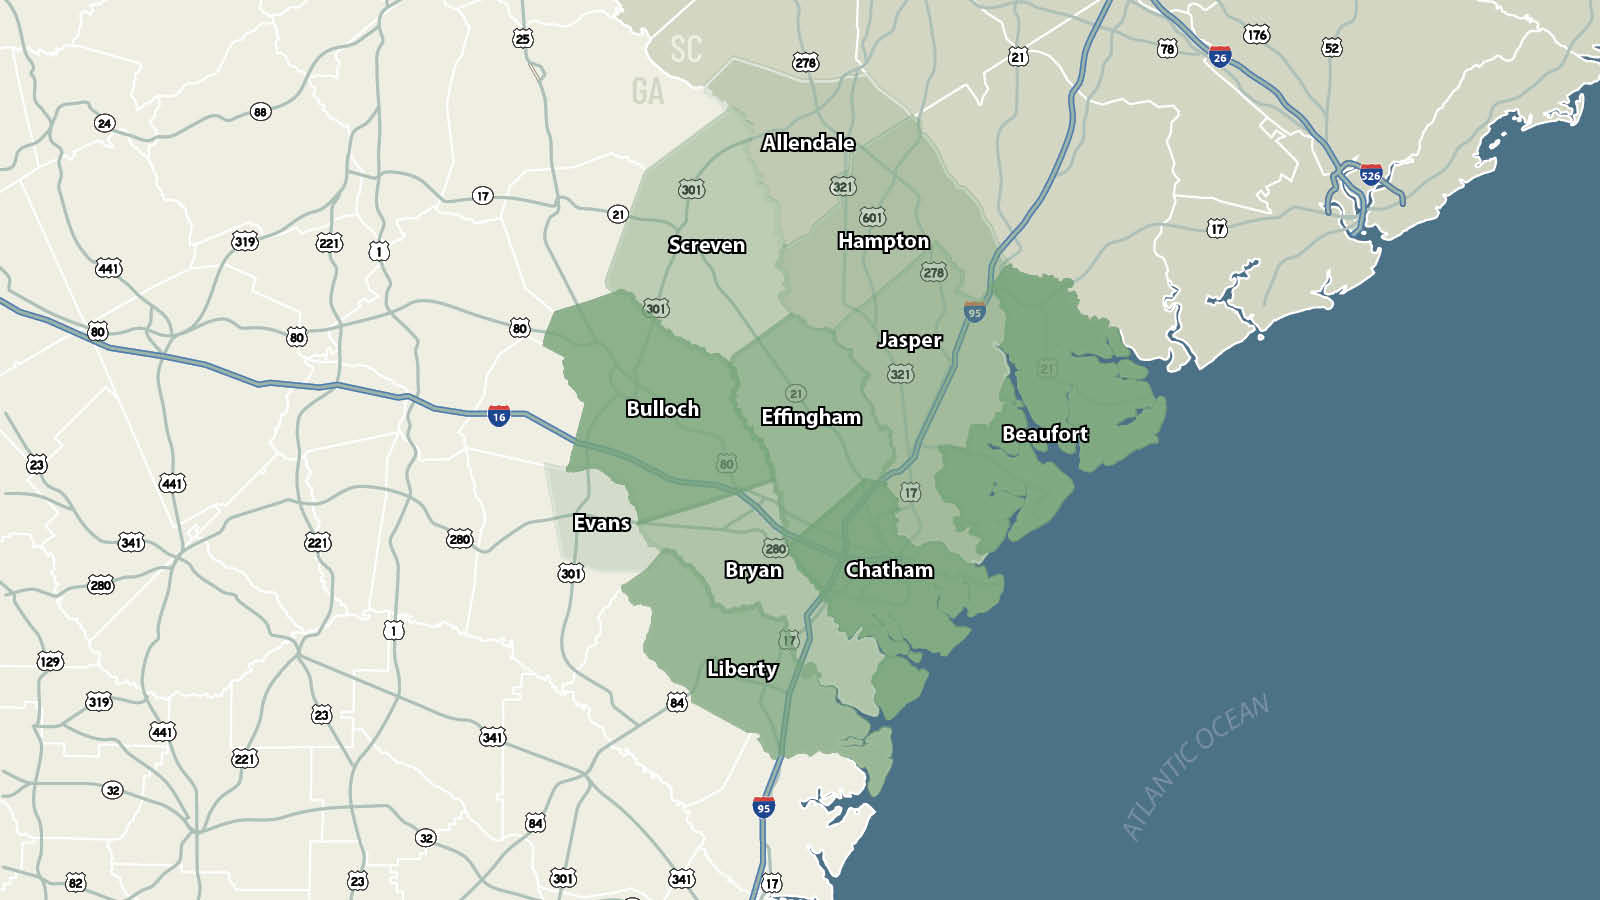
350,000+ in labor force within 45 minutes
| Labor Draw |
|---|
| < 4,737 |
| 4,737 to 13,582 |
| 13,582 to 19,345 |
| 19,345 to 30,883 |
| 30,883 to 68,359 |
| > 68,359 |
Source: JobsEQ, ESRI, 2020
|
|
350,000+ in labor force within 45 minutes
Source: JobsEQ, ESRI, 2020 |
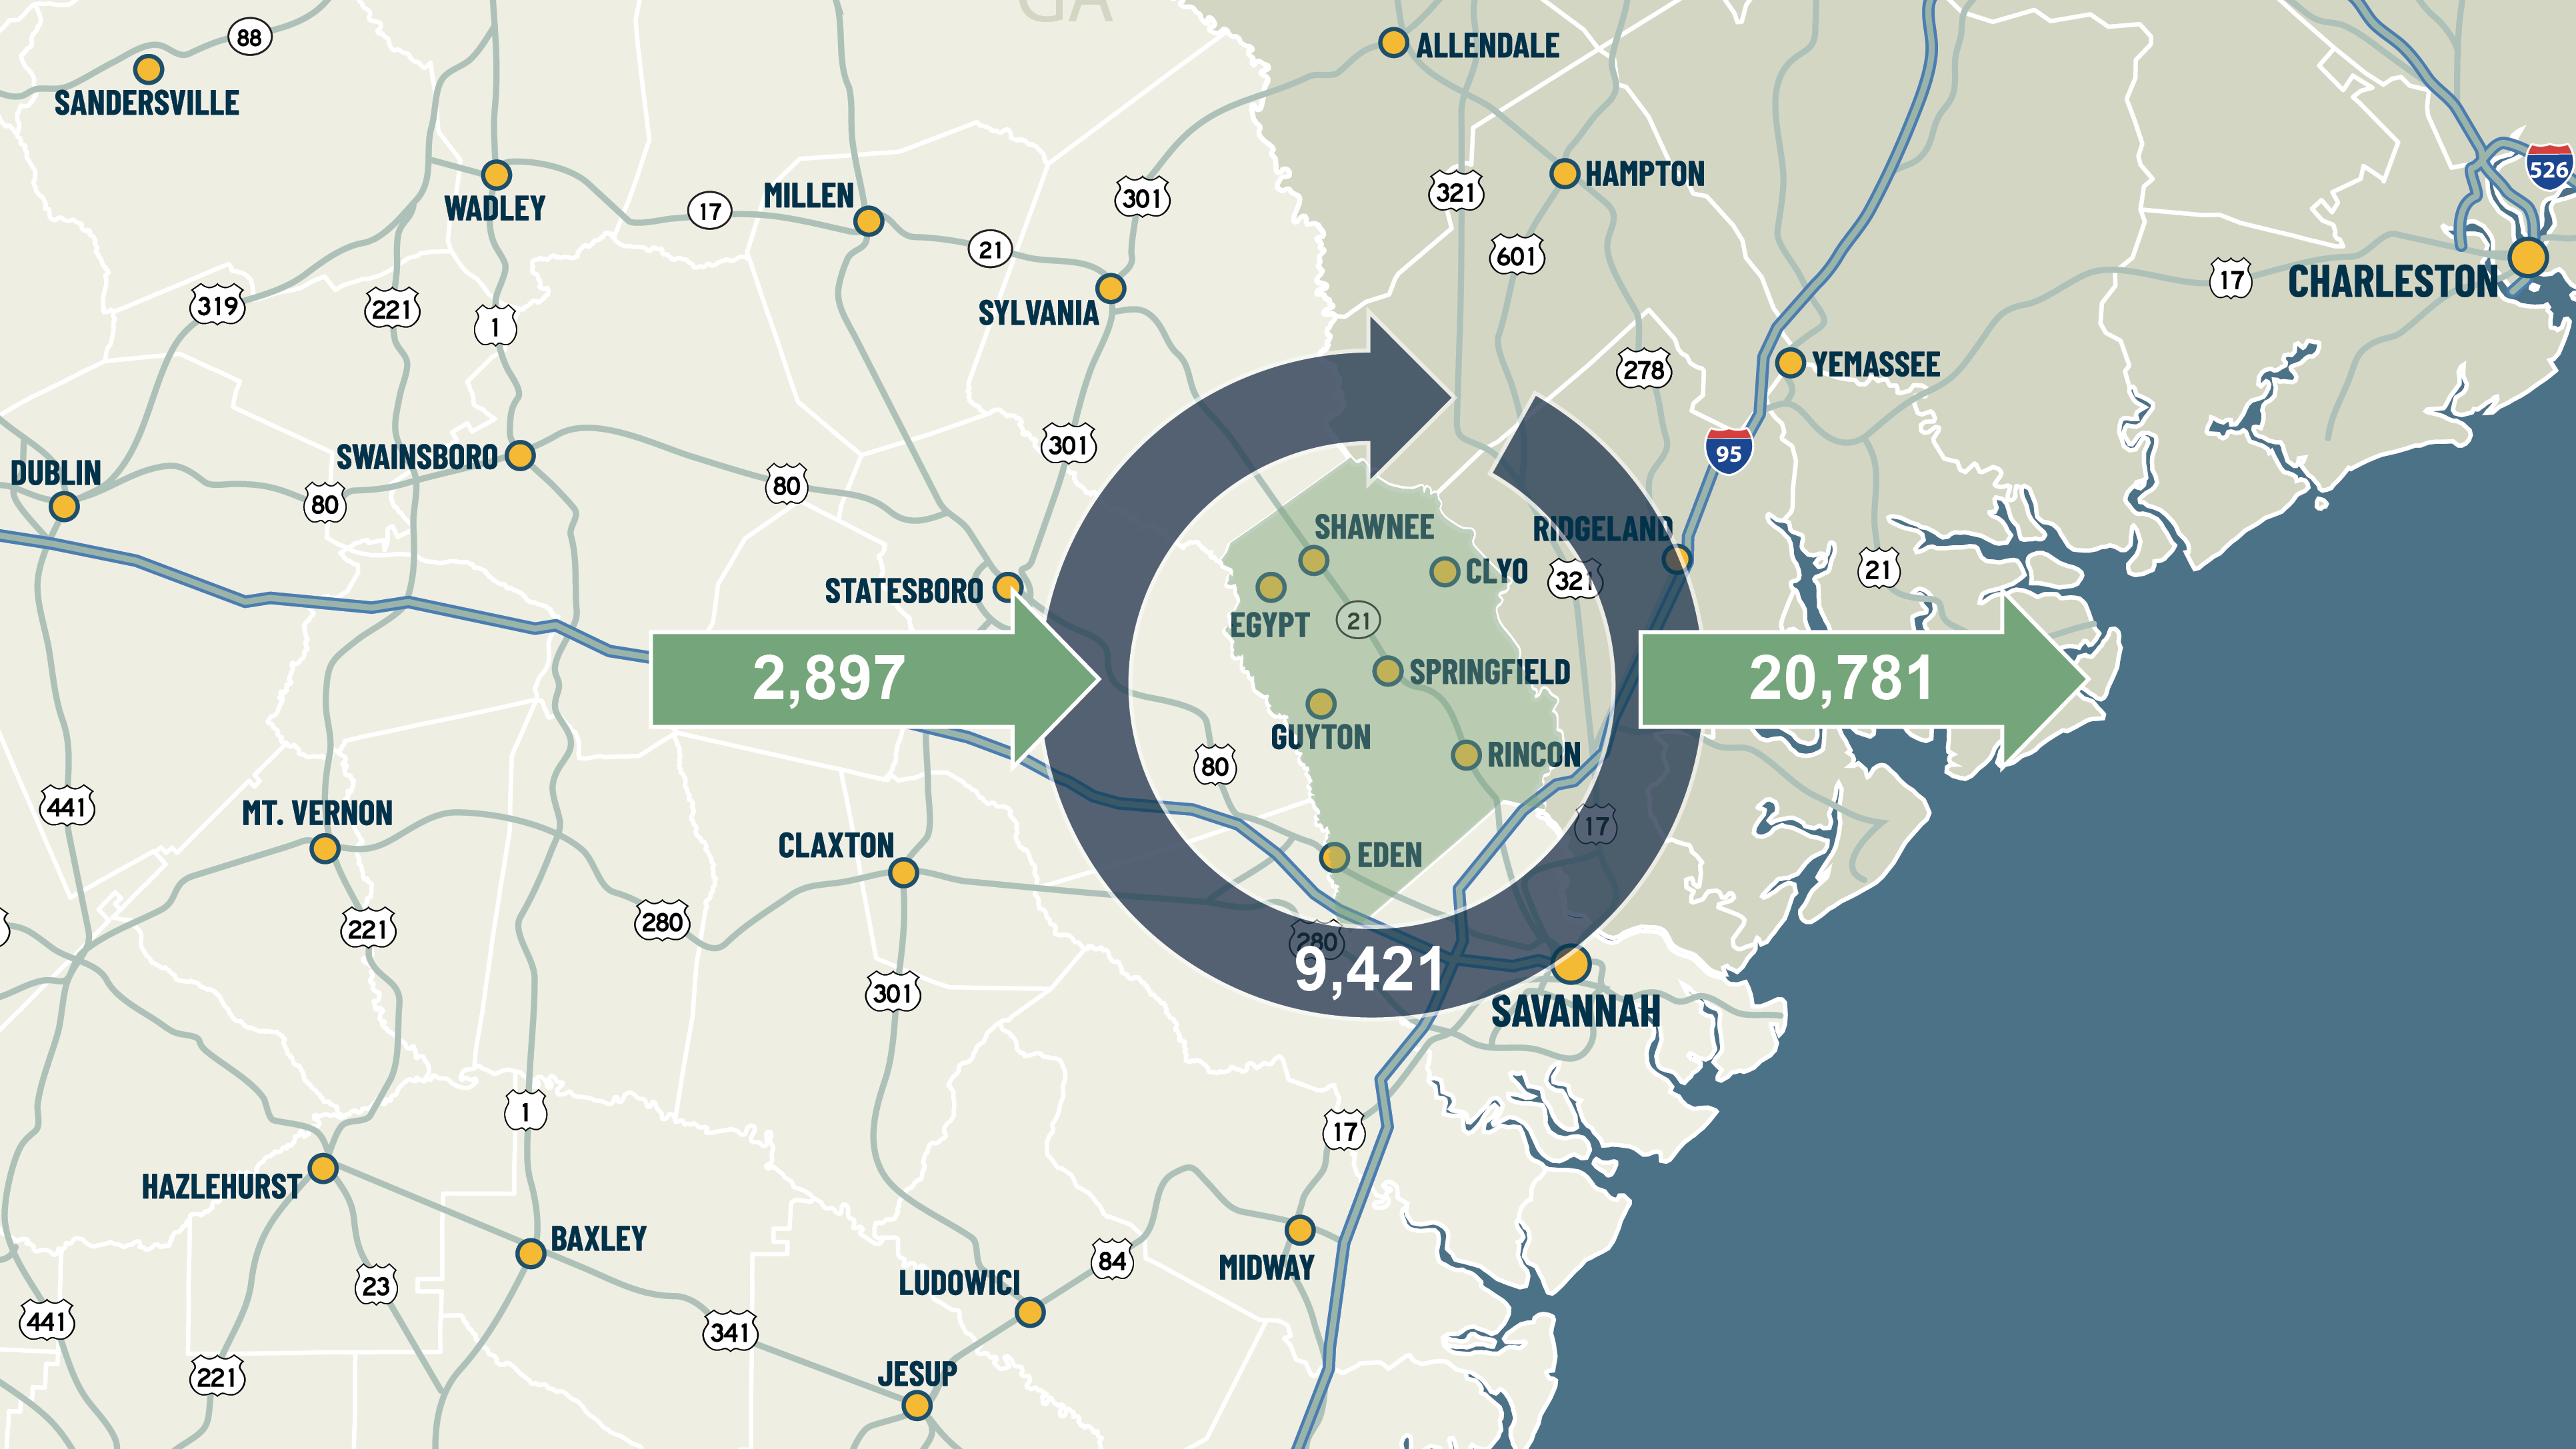
Commute Pattern
20,700+ out commuters
| # | |
|---|---|
| In Commuters | 2,897 |
| Live and Work in Effingham | 9,421 |
| Out Commuters | 20,781 |
Source: U.S. Census Bureau, 2020
20,700+ out commuters
Source: U.S. Census Bureau, 2020 |
|
| Commuter Destination | Count | Share |
|---|---|---|
| Chatham County | 14,045 | 47% |
| Effingham County | 9,421 | 31% |
| Bryan County | 674 | 2% |
| Bulloch County | 513 | 2% |
| Beaufort County, SC | 474 | 2% |
| Jasper County, SC | 344 | 1% |
| Glynn County | 320 | 1% |
| Liberty County | 290 | 1% |
| All Other Locations | 4,122 | 14% |
Source: JobsEQ 2020
labor characteristics
| Effingham County |
Savannah MSA |
45 Minute Commute |
|
|---|---|---|---|
| Labor Force | 33,643 | 207,420 | 392,070 |
| Median Age | 36.6 | 36.7 | 38.4 |
| Veterans in Labor Force | 3,539 | 16,079 | 29,322 |
| Average Commute Time (minutes) | 31.1 | 25.1 | 25.0 |
Source: JobsEQ 2026